Determine the value of pi with n number of samples

using Random, LinearAlgebra, PlotsRandom.seed!()
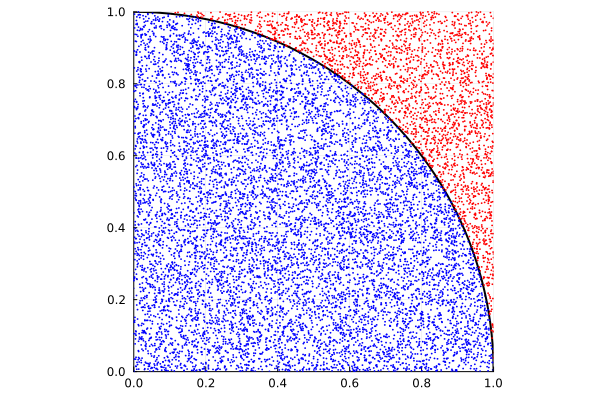
N = 10^4data = [[rand(), rand()] for _ in 1:N]indata = filter((x)-> (norm(x) <= 1), data)outdata = filter((x)-> (norm(x) > 1), data)piApprox = 4 * length(indata)/Nprintln("Pi estimate: ", piApprox)
scatter!(first.(indata), last.(indata), c=:blue, ms=1, msw=0, xlims = (-1, 1), ylims=(-1, 1))scatter!(first.(outdata), last.(outdata), c=:red, ms=1, msw=0, xlims=(0, 1), ylims=(0, 1), legend=:none, ratio=:equal)
# savefig("quarter_circle.png") 
using Random, LinearAlgebra, PlotsRandom.seed!()
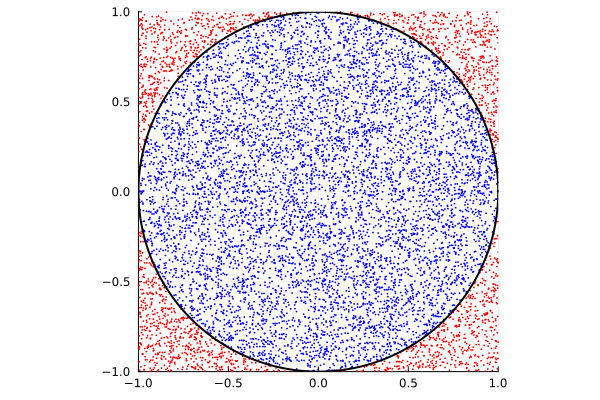
N = 10^4data = [[2 * rand() - 1, 2 * rand() - 1] for _ in 1:N]indata = filter((x) -> norm(x) <= 1, data)outdata = filter((x) -> norm(x) > 1, data)piApprox = 4 * length(indata) / Nprintln("Pi estimate: ", piApprox)
scatter(first.(indata), last.(indata), c=:blue, ms=1, msw=0, xlims=(-1, 1), ylims=(-1, 1), legend=:none, ratio=:equal)scatter!(first.(outdata), last.(outdata), c=:red, ms=1, msw=0, xlims=(-1, 1), ylims=(-1, 1), legend=:none, ratio=:equal)plot!(x -> sqrt(1 - x^2), -1, 1, c=:black, lw=2)plot!(x -> -sqrt(1 - x^2), -1, 1, c=:black, lw=2)
# savefig("whole_circle.png")function approximate_pi(n) data = [[2 * rand() - 1, 2 * rand() - 1] for _ in 1:n] indata = filter((x) -> norm(x) <= 1, data) piApprox = 4 * length(indata) / n return piApproxend
values = [10, 20, 50, 100, 200, 500, 1000, 2000, 5000, 10000, 20000, 50000, 70000, 100000, 200000, 500000, 700000, 1000000]
pi_values = [approximate_pi(i) for i in values]
print(pi_values)
# create a scatter plot where xlims is 2.0 to 4.0scatter(pi_values, c=:blue, lw=2, ylims=(2.0, 4.0), label="π approximation")
# plot a red horizontal line at 3.14159, and set the labelplot!([3.14159 for i in 0:length(values)], c=:red, lw=2, label="π")